
Redekop Manufacturing manufactures a harvest seed-control unit designed to destroy harvestable weed seeds. The seed-control unit attaches to the combine harvester and processes material coming from the cleaning system. Redekop tasked PAMI to provide an independent, third-party evaluation of the seed-control unit’s effectiveness at devitalizing seeds in a controlled test environment, while following both the Walsh protocol and a second industry protocol (both of which are further discussed in the following section.)
Seed Control Unit Devitalization Test
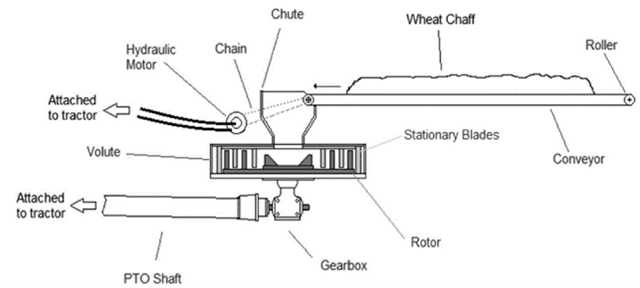
Walsh et al. (2017) published a paper outlining a general procedure for testing harvester seed mills in Australia’s cropping regions. Industry groups have also been striving to develop a more comprehensive protocol based on the Walsh procedure to include variables such as chaff throughput, mill operating speed, mill condition, and a longer processing time; referred to as Protocol 2 throughout this report. Both procedures use similar experimental equipment, as depicted in Figure 1. A conveyor belt is loaded with a specific chaff and weed-seed ratio and then engaged at an equivalent mass throughput speed into the seed mill. The processed material is then collected and subsampled into smaller portions for the laboratory germination tests. The germination results are used to evaluate the seed mill devitalization efficacy.
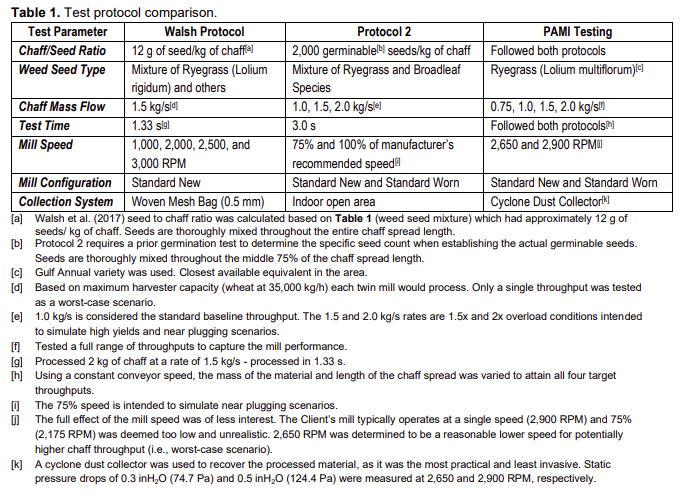
The differences between the Walsh protocol and Protocol 2 are itemized in Table 1. Minor changes were made to both procedures when benchmarking the Client’s SCU. These changes reflect practical adaptations to streamline the testing process. Despite this, PAMI followed the true nature of both protocols.
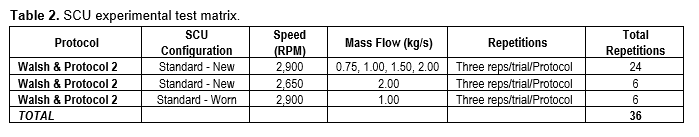
The test matrix displayed in Table 2 was based on the criteria from Protocol 2 and the Client’s request. Each permutation had three repetitions for a total of 36 tests. Gulf Annual Ryegrass (Lot No. Y2219713 – Item 68955 [3.25 g/1,000 seeds]) was used, as it was the closest equivalent to the protocols that was available for testing.
The chaff-to-grain ratio can be varied based on numerous harvesting factors (yield, variety, location, growing conditions, etc.). Current literature suggests a range between 10% to 30% depending on the yield. Walsh et al. (2017) assume a ratio of 15%. Protocol 2 had referenced recent work from Walsh et al. (2022) showing a chaff-to-grain ratio closer to 10%. The standard baseline of 1.0 to 1.5 kg/s of equivalent chaff throughput may be subject to change depending on the accepted chaff-to-grain ratio.
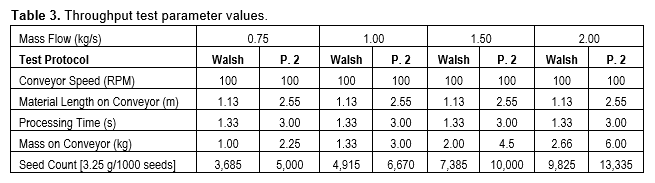
To achieve all four material throughputs, the mass of the material and the length of the chaff spread was varied while maintaining a constant conveyor speed. The respective test parameter values for each throughput and protocol are outlined in Table 3. It should be noted that Protocol 2 requires a germination test to determine the germinable seed count and chaff ratio. Given the testing timeline and partially available data, PAMI assumed a 90% germination rate while determining the seed counts for Protocol 2. The Walsh protocol simply states a fixed mass of seed for the seed-to-chaff ratio (Table 1).
TEST SET-UP AND PROCEDURE:
Figure 1 and Figure 2 show the equipment layout used in the tests. The conveyor was positioned above the SCU and equipped with a transition chute to guide the chaff into the SCU opening. A cyclone dust collector was used to recover the processed material, as it was the most practical and least invasive. Static pressure drops of 0.3 inH2O (74.7 Pa) and 0.5 inH2O (124.4 Pa) were measured at 2,650 and 2,900 RPM, respectively, which was considered a minimal restriction.
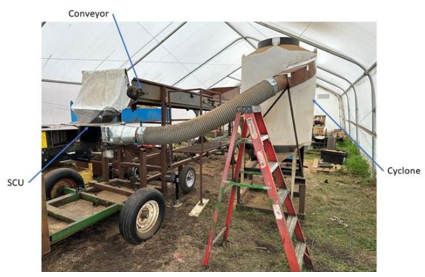
A New Holland T7.230 (165 kW/225 hp) tractor unit was coupled to the SCU with the power take-off (PTO). A data acquisition system (eDAQ) was used to record the SCU RPM during testing.
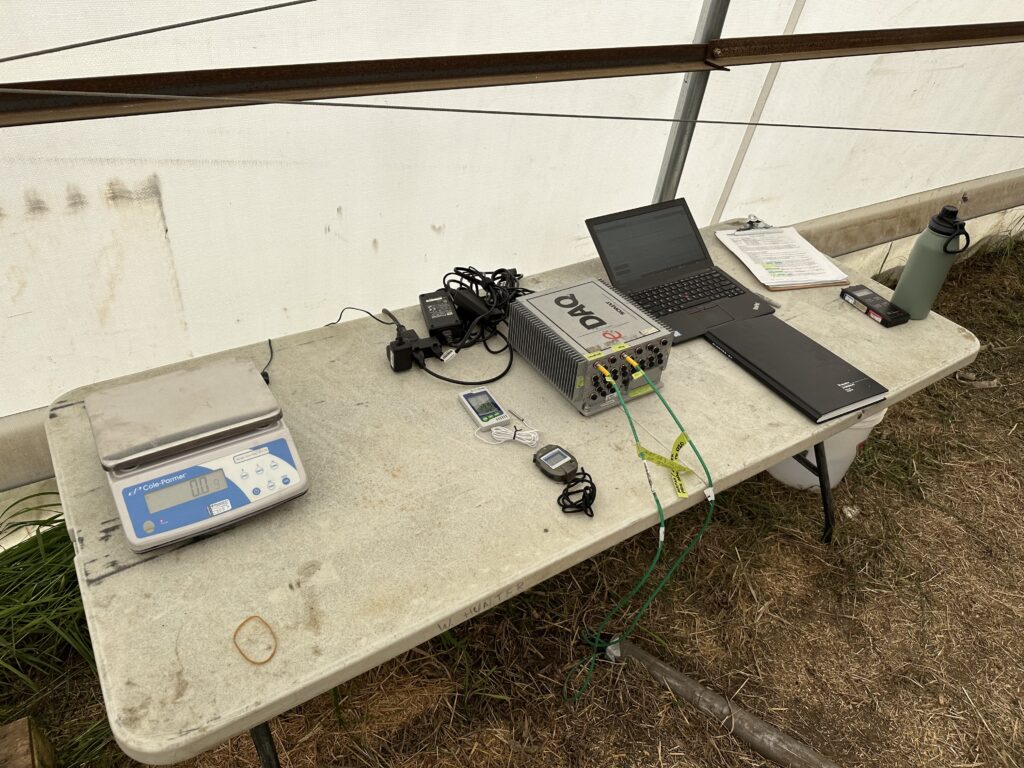

Figure 4 shows an example of chaff placement on the conveyor for both the Walsh protocol and Protocol 2. The Walsh protocol required less material and had a shorter duration than Protocol 2.
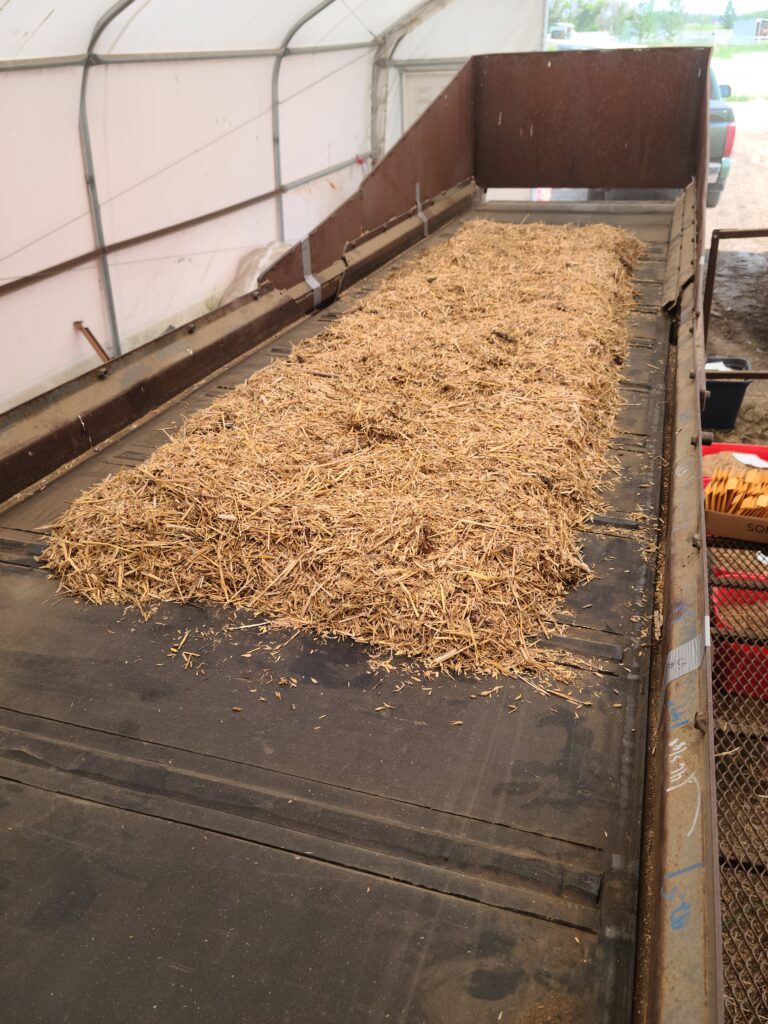
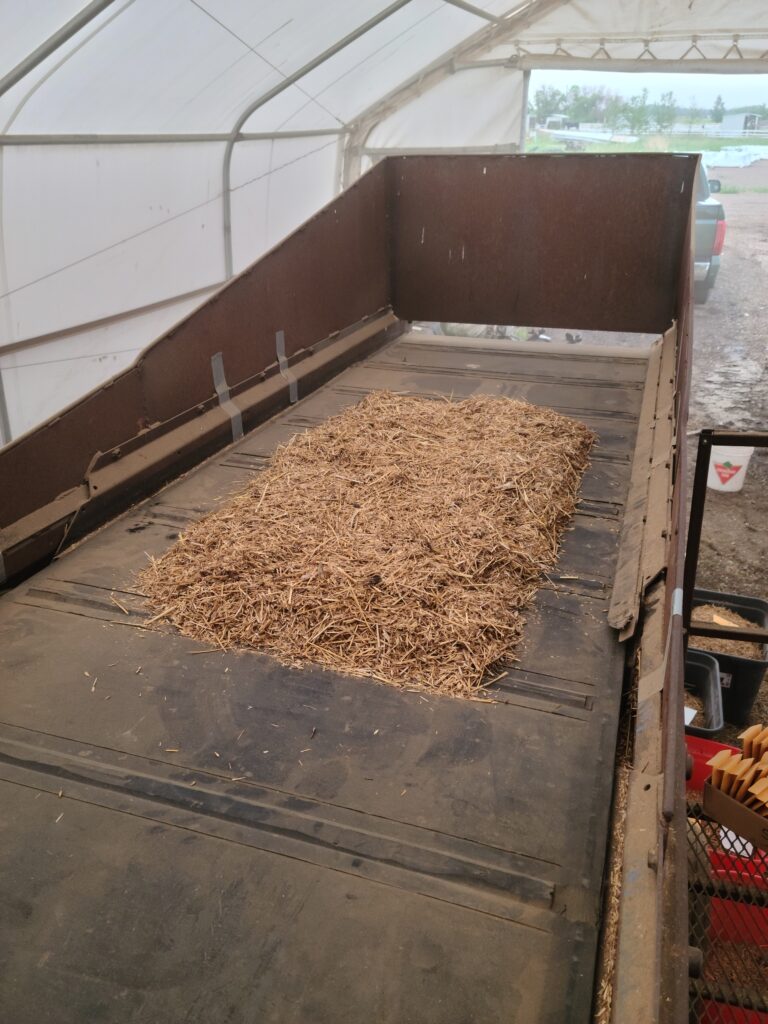
A specific chaff-and-seed ratio (Table 3) was prepared on the conveyor before each run. The chaff was first placed in the centre of the conveyor and then the correct number of Ryegrass seeds were mixed in. It is worth reiterating that the Walsh protocol requires a thorough mixing of seeds throughout the entire length of the spread. However, Protocol 2 requires only the middle 75% of the spread be mixed with seeds. After loading the chaff and seeds onto the conveyor, the SCU was brought to speed before engaging the conveyor. The material was then collected from the cyclone after processing in the SCU. Each repetition was subdivided into approximately 100 g using a rotary sampler (Figure 5). These samples were then given to an independent seed testing laboratory for seed germination testing. Baseline samples of processed and unprocessed chaff (with and without seeds) were also sent for germination testing. This was meant to identify any pre-existing seeds in the chaff material.

TEST RESULTS:
Discovery Seed Labs Ltd. (DSL) in Saskatoon conducted the independent germination testing for all the trials (June to August 2023) by following the protocol outlined in the Canadian Methods and Procedures for Testing Seed (2013, CFIA).
Each processed subsample was mixed with an equal mass of soil and set to germinate in a lab-controlled environment for 28 days. The subsamples were also divided into five smaller samples to promote germination. Germination results were recorded weekly; the total amount of germinated seeds was shared with PAMI.
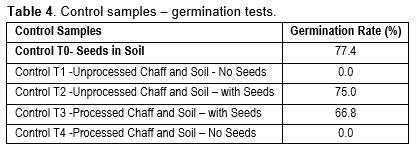
Before processing the data, the controlled germination test (T3; processed chaff and soil with 500 seeds) was used as a baseline for adjusting the kill rate. As such, a baseline germination rate of 66.8% was recorded and used to establish the new total seed count in the samples when calculating the kill rate (Table 4).
GENERAL RESULTS:
Table 5 compares both protocols in the standard configuration for a 1.0 kg/s throughput (considered the standard baseline). As previously identified in Table 3, Protocol 2 utilizes more chaff and seed throughout a test to create a longer test duration when compared to the Walsh protocol. The calculated coefficient of variation (CV) and Standard Errors are slightly higher with Protocol 2. This is likely due to the greater amount of material being processed. The increase in variability also appears to be proportional to the decrease in SCU speeds highlighted in Figure 6 and Figure 7.
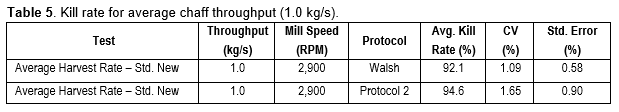
Figure 6 and Figure 7 shows sample runs of the measured SCU speed for both protocols at each chaff throughput. When material is introduced into the SCU, a slight decrease in speed occurs. In normal operations with a harvester, the SCU operates in steady-state conditions with a pre-set speed of 2,900 RPM when processing material. The test methodologies differ from typical operating conditions by having a pre-set speed when unloaded (no material). Figure 6 and Figure 7 highlight the sudden surge of material with the decrease in speed. The Walsh protocol and Protocol 2 had similar decreases in speed with respect to chaff throughput as identified in Figure 9. Walsh had a slightly larger peak drop in speed but quickly recovered compared to the Protocol 2 tests. With larger amounts of chaff being processed, Protocol 2 decreased in speed for a longer duration.
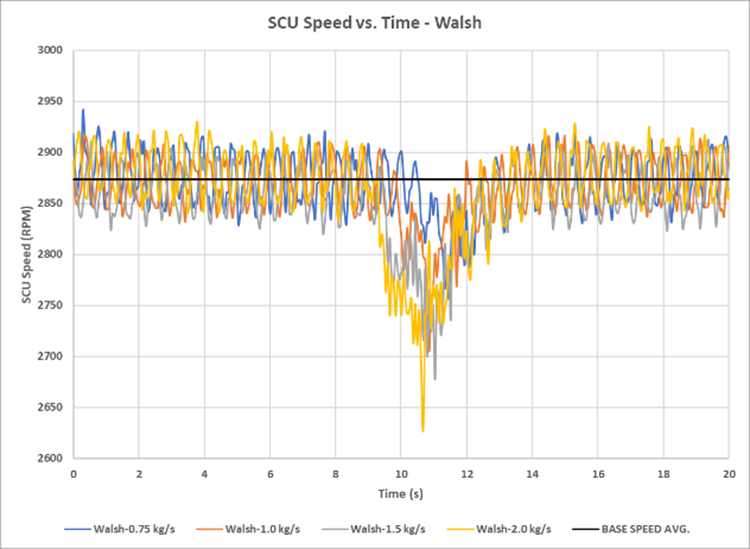
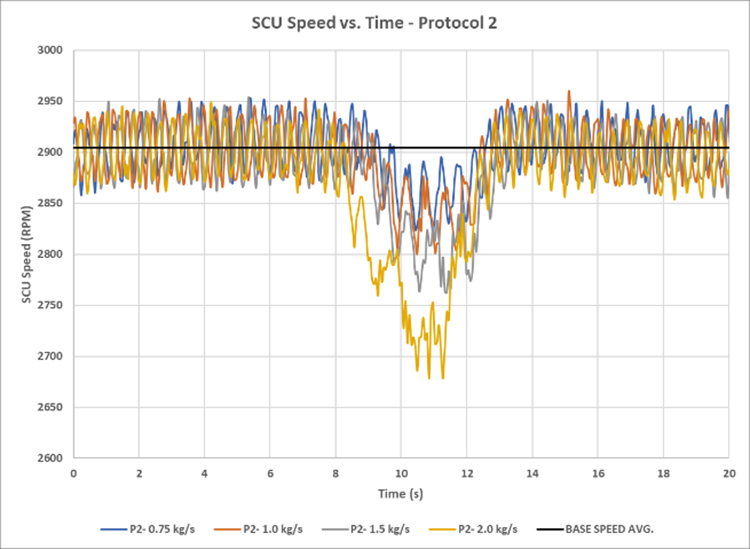
In general, as the chaff rate increased, so did the drop in SCU speed (Figure 8). Both protocols are designed to process equivalent amounts of chaff on a mass flow basis (kg/s) but for different durations. Despite this, the protocols encountered varying degrees of speed fluctuations at the respective throughputs. The seed placement within the chaff spreads also differed as per the protocol requirements (Table 1). The combination of the test duration, speed drop, and seed locations within the chaff may have impacted the variability observed in the kill rates.
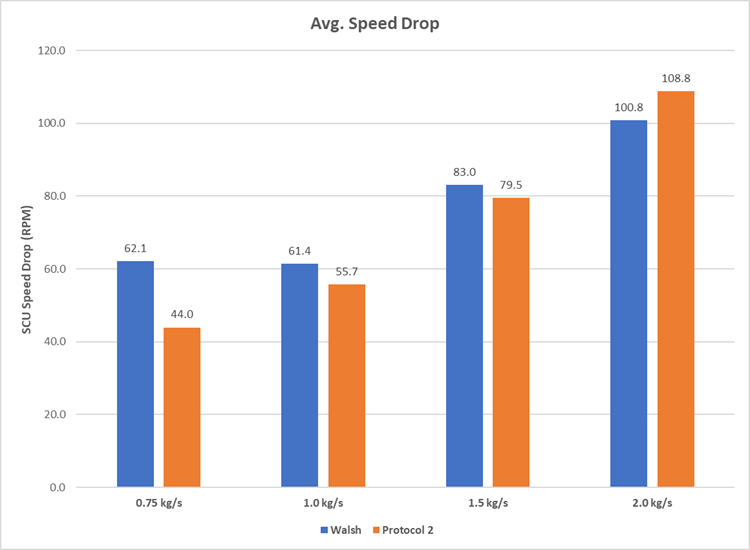
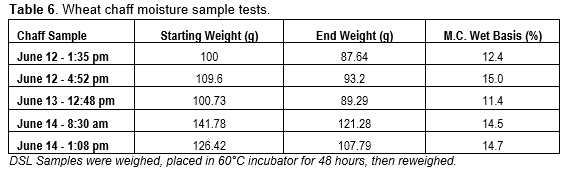
Table 6 outlines the measured wheat chaff moisture contents during the testing period. The moisture remained relatively constant throughout the tests (varied 1% to 5%). No analysis was conducted to identify the potential effect of moisture on the kill rate. Walsh et al. (2017) had previously conducted such tests where they found a decrease in kill-rate efficacy when increasing the moisture content in some instances. Efforts were made throughout testing to ensure a consistent chaff moisture content by storing indoors and occasionally mixing the material.
STATISTICAL ANALYSIS:
The R-Stats package (version 4.3.1) was used to conduct an Analysis of Variance (ANOVA), and variable correlation.
To appropriately identify any potential effects on the seed kill rate, three sub-datasets were generated to isolate the variables of interest when conducting the ANOVA. For each test, the P‑Values and analysis are included in the Appendix.
Based on the statistical analysis, the kill rate was found to be correlated to the throughput and the SCU speed. The kill rate data at the varying throughputs and speeds were significantly different from each other. Comparing the SCU conditions (new vs. worn), no significant difference was observed with respect to the kill rate. Similarly with the Walsh and Protocol 2 test methods, the kill rates were not significantly different.
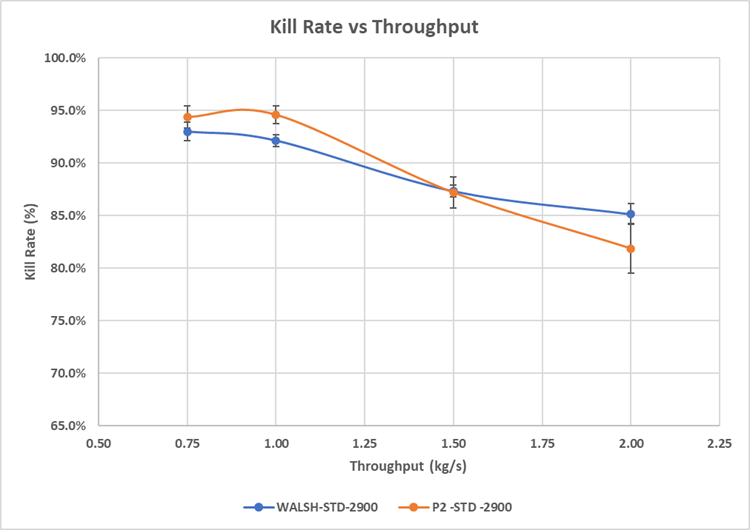
Figure 9 displays the average kill rate with respect to the chaff throughput. In all conditions, a decreasing kill rate trend is observed as the throughput increases. It is also apparent that the CV increases with the chaff throughput.
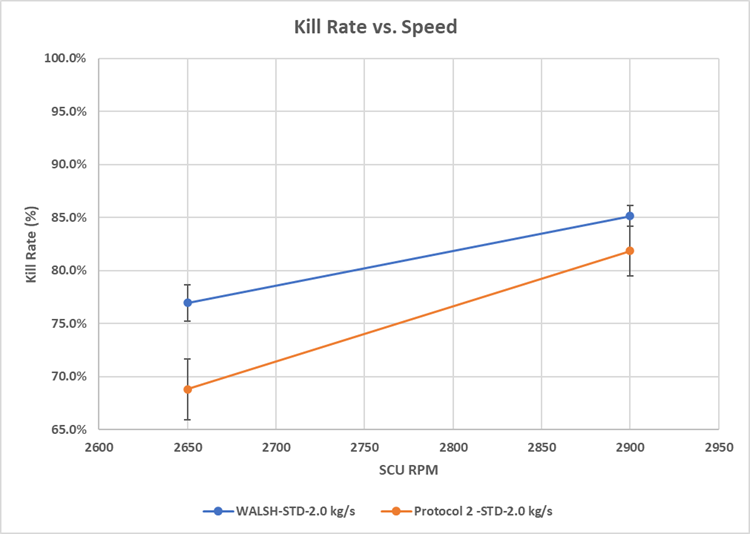
Despite only having two SCU speeds for comparison, the visible trend in Figure 10 confirms the results from the statistical analysis. As the speed increases, so does the resulting kill rate. It should be noted that the speed settings were set without product within the SCU. As the chaff and seed were introduced into the system, the speed would drop 2% to 4% below the set speed depending on the throughput (Figure 8).
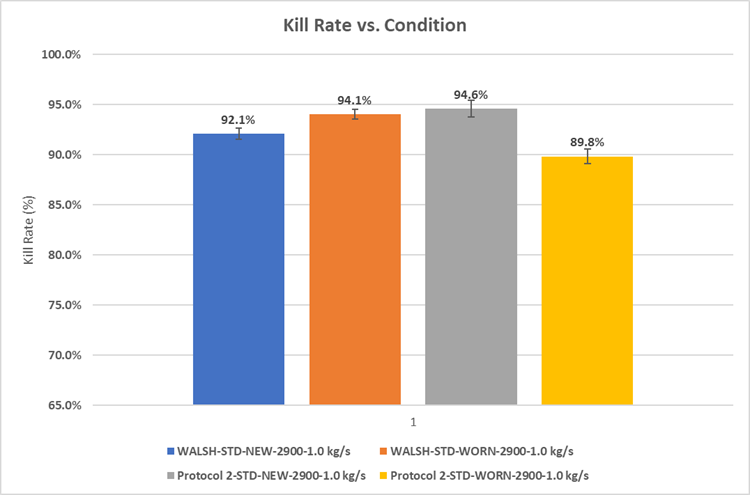
As also identified within the statistical analysis, the kill rate was not significantly affected by the condition of the SCU unit. The worn and new stators had varying trends between the test protocols, as seen below in Figure 11. The Walsh protocol displayed a slight increase in kill rate while Protocol 2 showed a decrease when changing to the worn stator.
CONCLUSIONS AND OBSERVATIONS:
Both the Walsh protocol and Protocol 2 attempt to establish a consistent and repeatable methodology for testing the effectiveness of a harvester weed-seed mill. Walsh established the initial template, which was further developed in Protocol 2. Walsh et al. (2017) used a single worst-case throughput of 1.5 kg/s and varied mill speeds to evaluate the seed kill rate. Protocol 2 had three levels of throughput (1.0, 1.5, and 2.0 kg/s), two speeds (75% and 100%), and accounted for the condition of the mill (new versus used). The interpreted intention of Protocol 2 was to create longer and more consistent trial runs at varying operating conditions. The Walsh and Protocol 2 runs have equivalent durations of 1.33 s and 3.00 s, respectively.
PAMI adopted both methodologies by testing four throughputs (0.75, 1.0, 1.5, and 2.0 kg/s), two speeds (2,650 and 2,900 RPM), and two stator conditions (new and worn). Except for the catch system (cyclone dust collector), both methodologies were followed. A cyclone dust collector was used to recover the processed material, as it was the most practical and least invasive.
The initial data displayed higher levels of variance (CV: 2% to 6%) among the kill rates conducted at 2.0 kg/s throughput with Protocol 2. The other kill rates had CV values of 1% to 3%. A decrease in mill speed (2% to 4%) was observed during these higher throughputs. With the larger overall quantity of chaff used with Protocol 2 (1.5 and 2.0 kg/s), the kill rate efficacy varied significantly.
The statistical analysis identified the throughput and mill speed as the variables that significantly affected the kill rate. The condition of the mill and the test protocol (Walsh and Protocol 2) had no significant impact on the kill rate.
The following are PAMI’s recommendations after completing testing on the Client’s SCU:
- Consider increasing the number of baseline germination tests to reduce potential variability when adjusting the potential kill rate.
- Consider increasing the number of sub-samples for the germination tests.
- A better representation of the seed devitalization efficacy could be observed.
- Consider further investigation when establishing the chaff throughput values.
- Varying accounts and recorded datasets may suggest higher or lower ranges depending on several harvesting conditions (i.e., crop type, yield, moisture content, etc.).
- The principal objective of these methodologies is to establish consistent and repeatable results. Conditions in lab-controlled experiments may not always align with evolving crop varieties and operating scenarios.
- Consider replacing the high 2.0 kg/s throughput with an intermediate value. (i.e., between 0.75 and 1.5 kg/s)
- The higher CV value created more scatter among data.
- The 2.0 kg/s throughput may not be very representative of any realistic harvesting conditions.
- Consider setting the SCU speed while processing material instead of unloaded.
- This would align the speed with actual harvester field conditions.
- Consider increasing the mill speed range for future testing (three to four points).
- Speed optimization could lead to energy savings for a given acceptable kill rate.
REFERENCES:
Canadian Food Inspection Agency. 2012 Version. Canadian Methods and Procedures for Testing Seed. Section: 4.0 Germination
South Australian Grains Industry Trust (SAGIT) Project. 2022. Trengove Consulting & University of Adelaide Weeds Research.
Walsh, M. J., Broster, J. C., Powles, S. B. 2017. iHSD Mill Efficacy on the Seeds of Australian Cropping System Weeds. Weed Science Society of America.
Walsh, M. J., Broster, J. C., Tayner, A. K., Sturt, C. 2022. Seed destruction when using a stripper front – does it work. Australian Government – Grains Research Development Corporation (GRDC).